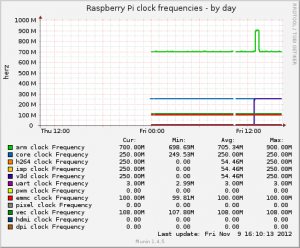
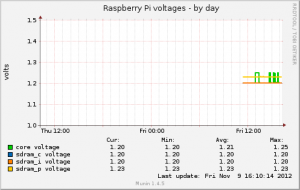
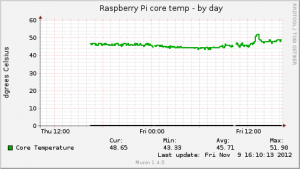
So these are the charts the Munin plugin generates.
Clock frequencies.
Voltages.
Temperature.
I changed how the voltages were collected which is why that graph doesn’t have much data on it yet, and I’ve fixed the spelling error on the temperature graph in the GitHub version of the code.


I tweaked it a bit in the logic…
/opt/vc/bin/vcgencmd measure_temp| egrep “[0-9.]{4,}” -o >/dev/null 2>/dev/null; then